Color Blindness in UI Design: A Practical Guide
TL;DR: The Verdict
About 1 in 12 men live with some form of color vision deficiency. Red reads close to green for them, and a red error message next to a green success message can look like the same muddy tone twice. When your interface leans on hue alone to carry meaning, part of your audience misses the message.
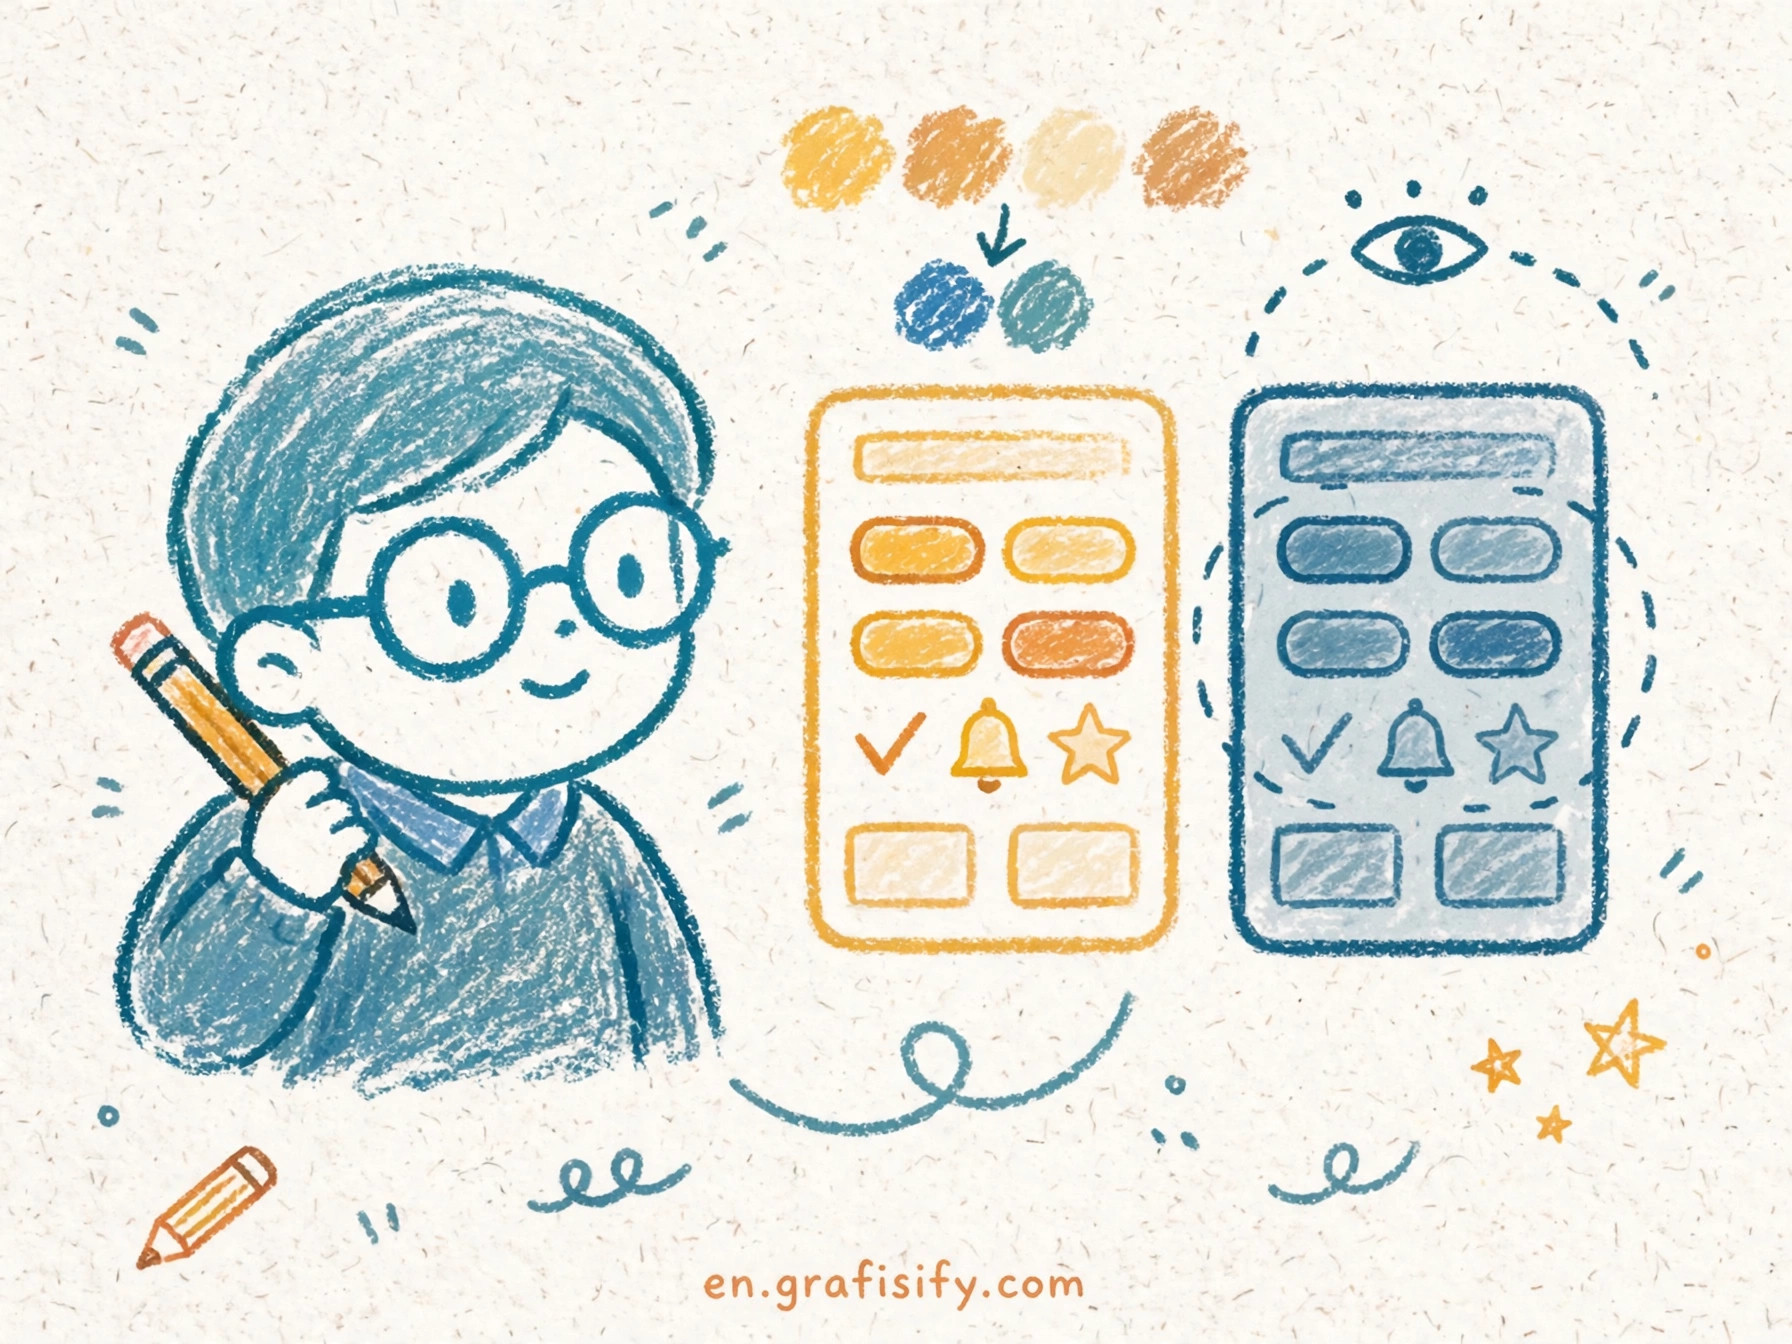
The fix costs little and it changes the design for the better. Pair each color cue with a second signal: lightness, shape, pattern, label, or icon. Check text contrast against WCAG numbers. Run a simulator over the finished screens before you ship. I run this check on each palette I approve, and the result stays consistent: the design gets clearer for all readers, colorblind readers included.
Four points carry the whole guide:
- Color must never carry meaning alone. WCAG 1.4.1 says so at Level A.
- Text needs 4.5:1 contrast at Level AA, and 3:1 for large text.
- Lightness separation beats hue separation. A dark red next to a light green stays readable when hue fails.
- A simulator plus a contrast checker catches most problems in under ten minutes.
Color Vision Deficiency in Plain Terms
Color vision deficiency, often called color blindness, means the eye separates some hues with less precision than typical vision. It is not a world in black and white. Most affected people see color. They see a narrower range of it, and some pairs of hues collapse into one.

Red-green deficiency dominates the numbers. Protan defects weaken red perception. Deutan defects weaken green perception. Both types make red and green hard to tell apart, and both show up far more in men than in women. The US National Eye Institute puts the figure at about 1 in 12 men. Color Oracle, a long-running simulation tool, cites 8 percent of men. Okabe and Ito, in their color universal design work, break the male rate down further: 1 in 12 Caucasian men, 1 in 20 Asian men, and 1 in 25 African men live with red-green deficiency.
Blue-yellow deficiency, called tritan defects, stays rare. Total color blindness, where a person sees in shades of gray, stays rarer still. One fact from WebAIM matters for palette choices: in red-green deficiency, blue perception stays intact. Blue keeps its identity when red and green lose theirs.
Mild cases pass unnoticed for years. A person with mild deuteranomaly sees traffic lights fine and picks matching clothes with no trouble. The same person stalls on your dashboard when the chart legend says “red means churn, green means growth” and both lines print as olive. I keep that image in mind when I review a chart: the person who struggles with it has no idea the chart is the problem. They think they misread it.


That gap between mild deficiency and total failure explains why the topic gets ignored. The affected users seldom complain. They adapt, they guess, and they move on. The interface never hears about it.
Spots Where Color-Only Design Fails
Color-only encoding hides in ordinary places. Each spot below has a fix that takes minutes, and each fix helps readers with typical vision too.
Charts and legends. A line chart with six thin lines in six hues turns into a puzzle when two hues merge. Add a second code: vary the line style, solid versus dashed versus dotted, and label each line at its end instead of hiding the key in a legend. Direct labels beat legends in every test I have run, because the reader never has to match a swatch to a line.
Status text. “Approved” in green and “Rejected” in red reads fine until the hues collapse. Put the word first and treat color as decoration. An icon next to the word adds a third cue: a check mark for approved, a cross for rejected. Status pills work when the text carries the meaning and the color adds speed for the reader who sees it.
Form errors. A red border on a bad field fails twice: the color may not register, and the border says nothing about the fix. Pair the border with an icon and a short message under the field that names the problem. “Enter a valid email address” tells the reader what to do. A red outline alone tells them something is wrong somewhere. Our guide to microinteractions for error states shows how small feedback details like this shape the whole form experience.

Links inside body text. A link that differs from body text by hue alone vanishes for a reader who cannot separate those hues. Underline links, or give them a weight change plus an underline on hover at minimum. This rule also helps readers on cheap screens and in bright sunlight, where hue differences wash out for all eyes.
Heatmaps and data scales. The classic green-to-red heatmap is the worst offender in this list. It maps the full data range onto the exact axis that red-green deficiency compresses. Switch to a single-hue scale that runs from light to dark, or use a blue-to-yellow scale, since blue perception stays intact. Add numeric labels on the cells that matter. A heatmap with numbers on each cell serves the reader who prints in grayscale too.
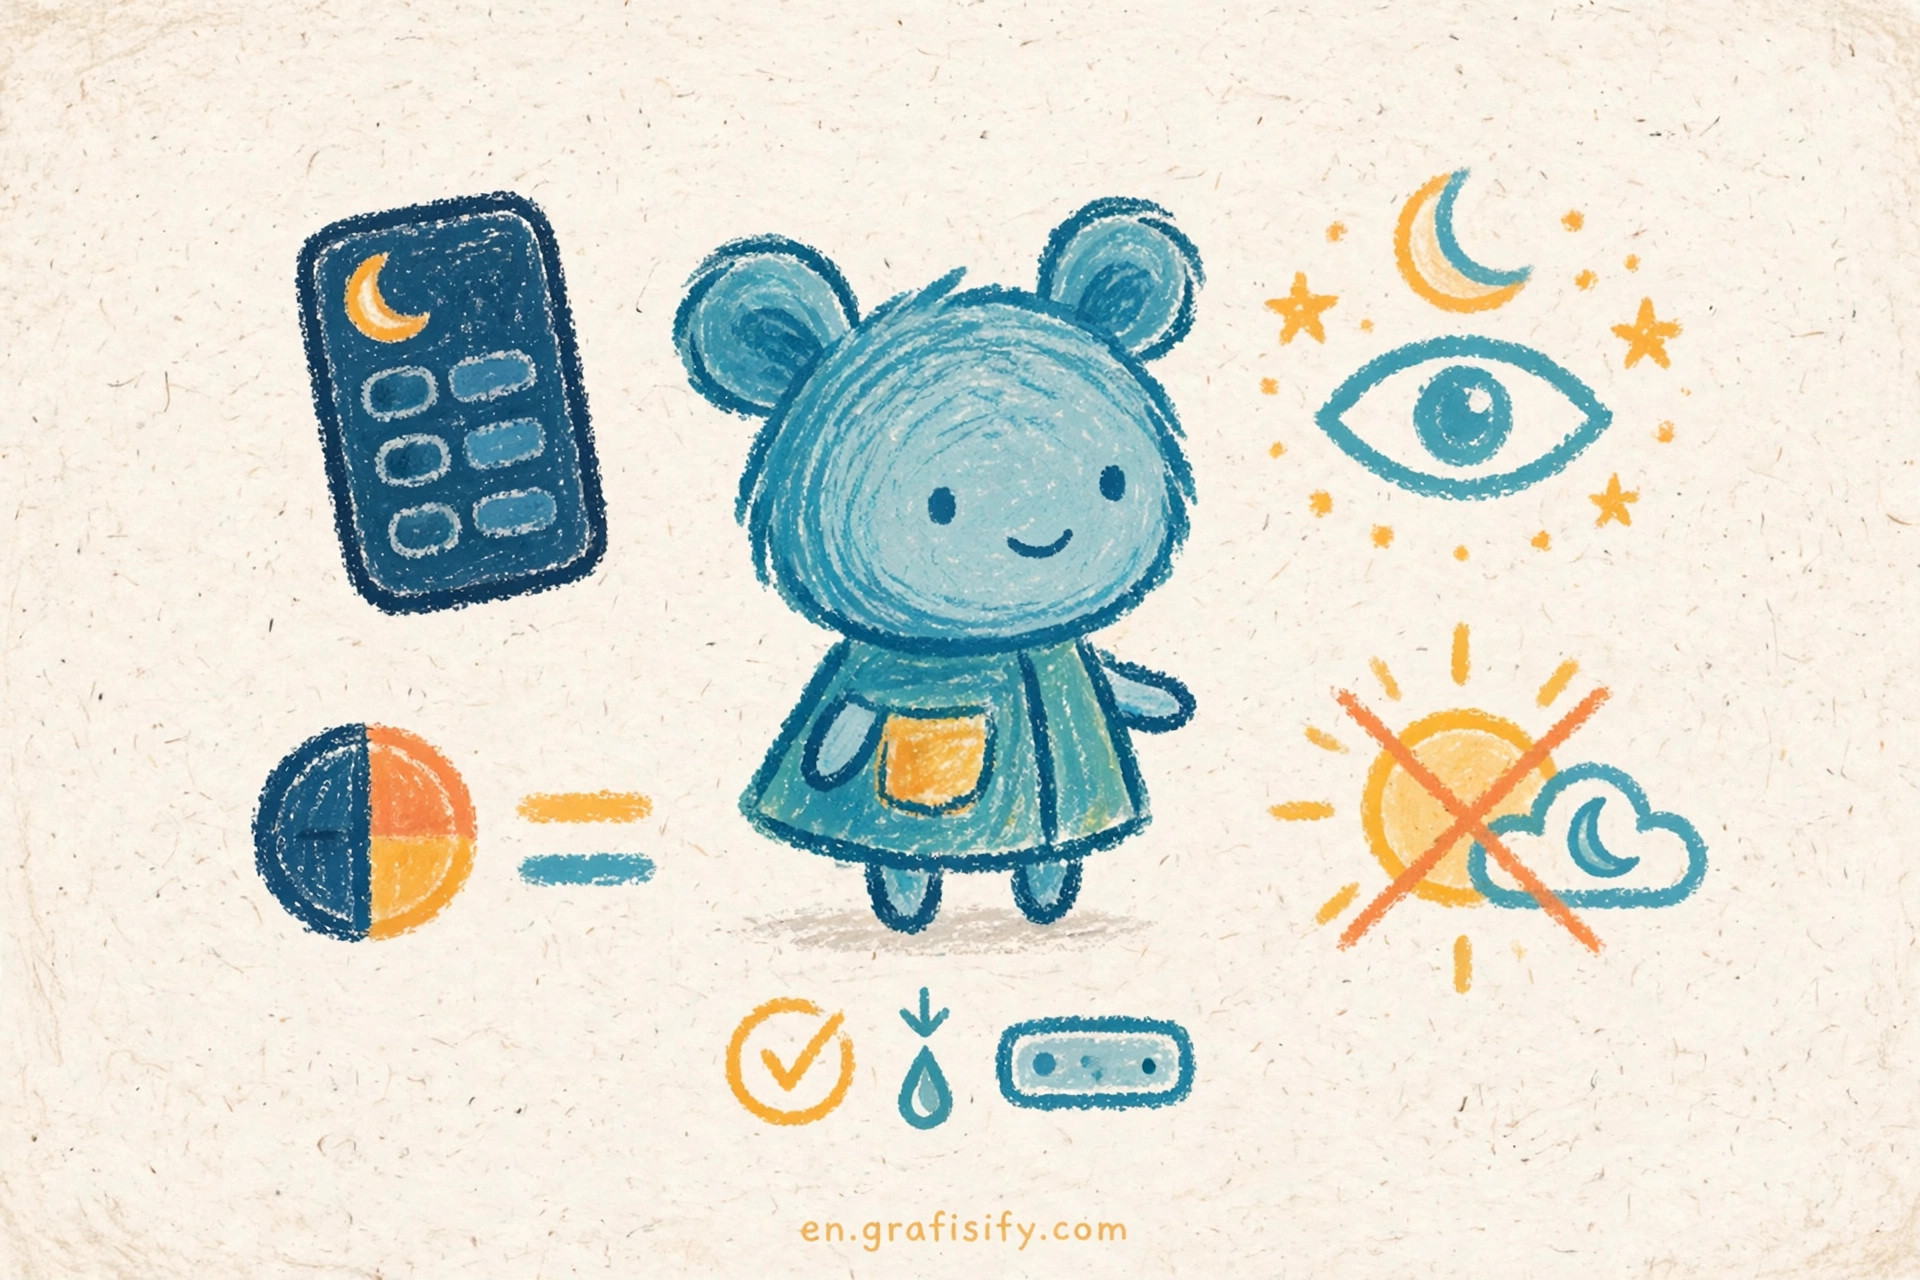
Dark mode states. Dark themes shrink the contrast budget. A muted red on a dark surface can drop below readable contrast even when the same red passes on white. Test each state color against the dark background, not against white. Our dark mode readability rules cover the background and surface choices that keep state colors legible after the theme switch.
Type choices. Hue is not the sole cue for hierarchy. Weight, size, and spacing carry structure when color drops out. I pair typefaces by weight and contrast, not hue alone, and the rule holds for buttons, captions, and labels as well as for headlines.
The WCAG Color Rules at a Glance
WCAG, the Web Content Accessibility Guidelines from the W3C, sets the baseline for accessible color use. Three success criteria cover most of what a designer needs. The thresholds below are identical in WCAG 2.1 and 2.2, so the table holds for both versions. Keep our WCAG contrast ratio cheat sheet open next to this table when you audit a screen.
| Criterion | Level | Threshold | Applies To | Common Audit Fail |
|---|---|---|---|---|
| 1.4.1 Use of Color | A | Color never the sole cue | Information, actions, prompts, visual distinctions | Red text alone marks an error |
| 1.4.3 Contrast (Minimum) | AA | 4.5:1 for text, 3:1 for large text | Text and images of text | Light gray body copy on white |
| 1.4.11 Non-text Contrast | AA | 3:1 against adjacent colors | UI components, icons, charts, focus states | Thin chart lines and pale borders |
Criterion 1.4.1 carries a note that designers miss. When two colors differ in lightness enough to reach a 3:1 contrast ratio, that lightness gap counts as an extra visual cue on its own. A dark red and a light green pass the test even though both sit on the red-green axis. Lightness is the lever. Hue is the decoration.
The WebAIM Million 2026 report shows how far the web sits from this bar. Low contrast text appeared on 83.9 percent of home pages, up from 79.1 percent in 2025, and it ranked as the most common accessibility issue found. Each home page carried 34 distinct instances of low contrast text on average, up 15 percent from 2025. Contrast is not a niche concern. It is the top failure on the modern web, and it is the easiest one to fix. Read the full numbers in the WebAIM Million 2026 report.
Building a Color-Safe Palette
A color-safe palette starts with lightness, not hue. Pick the semantic roles first: success, warning, error, info, neutral. Assign each role a distinct lightness step before you pick a hue. Dark green for success, mid amber for warning, dark red for error, and mid blue for info gives you four roles that stay apart in grayscale. Test the palette in grayscale at the start, not at the end. If the roles collapse in gray, the hues will not save them.
The Okabe-Ito palette gives you a tested starting set. Masataka Okabe and Kunihiko Ito designed eight colors that stay distinct under common forms of color vision deficiency: orange #E69F00, sky blue #56B4E9, bluish green #009E73, yellow #F0E442, blue #0072B2, vermillion #D55E00, reddish purple #CC79A7, and black #000000. The set is not a brand palette. It is a proof that distinctness comes from lightness and hue working together, and it works as a base for charts, diagrams, and data displays. The original explanation lives on the Okabe and Ito color universal design page.
Redundant coding turns a palette into a system. Give each semantic role a shape or pattern alongside its color. Success gets a check and a solid fill. Warning gets a triangle and a hatched fill. Error gets a cross and a striped fill. The pattern survives photocopies, projectors, and grayscale print, and it gives the color a partner that never depends on vision type.
Encode the result as tokens, not as loose hex values scattered through the stylesheet. A token like color-status-error carries the hex, the contrast pair, and the icon in one place, and a change in one token updates each screen at once. I encode the palette in your design token system as the last step of the palette build, after the lightness test passes and before the palette reaches production. Tokens also give the audit a single source of truth: one file lists each color, its role, and its contrast ratio.
Keep the palette small. Five semantic colors plus neutrals cover most products. Each extra hue adds a new pair that can collide, and a palette of twelve colors needs sixty-six pair checks. A small palette is not a limit on creativity. It is a limit on the places where meaning can break.
A Testing Workflow That Catches Problems Early
Three tools and one habit cover the testing pass. The habit comes first: screenshot each key screen, convert it to grayscale, and read it. If the meaning survives in gray, the lightness structure holds. If a status, a chart series, or a link vanishes in gray, the design leans on hue and needs a second cue. This test takes two minutes and it catches the worst failures before any tool runs.
Next, run a simulator over the live interface. Color Oracle applies a full-screen color vision deficiency filter to your whole display, so you see the product the way a deuteranope sees it. The tool has not shipped a new version since 2018 and the site shows its last update in 2020, so treat it as a stable utility rather than a product in active development. It still runs, and the full-screen simulation stays useful for a fast check. The National Eye Institute page on color blindness gives the prevalence background in plain terms if you need a source for the team.
Then check the numbers. The WebAIM Contrast Checker takes a foreground and background color and returns the ratio plus a pass or fail against WCAG AA and AAA. Run each text pair and each UI component pair through it. The W3C Understanding pages spell out the exact rules behind the numbers: criterion 1.4.1 on use of color, criterion 1.4.3 on contrast minimum, and criterion 1.4.11 on non-text contrast. The WebAIM article on color blindness and web design ties the prevalence data to practical design choices in one place.
Put the lint step into review, not into a separate audit. A contrast check in the design review catches a bad pair while the designer still has the file open. A palette lint in the pull request catches a bad token before it ships. I treat a failed contrast check the way I treat a failed build: the work does not merge until the number passes. The cost of that rule is a few minutes per review. The cost of skipping it is a product that hides information from a tenth of its male users.
Conclusion: Your Next Steps
Color blindness is common, it is invisible in user feedback, and it is cheap to design for. The prevalence numbers set the stakes: about 1 in 12 men, and 8 percent of men by the Color Oracle figure, read your interface through a narrower color range. The WCAG rules set the bar: color never carries meaning alone, text holds 4.5:1 contrast, and UI components hold 3:1. The palette and testing sections above give you the method: lightness first, redundant coding second, tokens third, and a grayscale plus simulator check before ship.
Run the audit this week. Pick your worst screen, the dashboard or the form with the most status colors, and run the grayscale test on it. Fix the first color-only cue you find. Then open our WCAG contrast ratio cheat sheet and check each text pair on that screen against the numbers. One screen, one fix, one check. That is the whole habit, and it compounds across each screen you touch next.

Irfan is a Creative Tech Strategist and the founder of Grafisify. He spends his days testing the latest AI design tools and breaking down complex tech into actionable guides for creators. When he’s not writing, he’s experimenting with generative art or optimizing digital workflows.



 Artificial Intelligent
 Design & Creative
 Freelance
 Gadgets & Gear
 Insights
 Laptop
 Reviews
 Smartphone
 Tech Guides
 Vibe Coding