LLM Observability: Tracing Production AI Apps

Production AI apps fail in ways HTTP status codes cannot describe. A request returns 200, the user still gets a wrong answer, and the bill still grows. LLM observability closes that gap. It records what each model call did, what it cost, and where time went, so teams fix the real cause instead of guessing.
Verdict: LLM Observability in 60 Seconds
Instrument model calls with traces, token metrics, latency metrics, and error counts. Ship that telemetry through OpenTelemetry into a backend you already run, or into a dedicated LLM tool when you need prompt level inspection. Keep prompt content out of traces by default. Track cost per request from day one, because token spend is the one metric that surprises every team. Start with one traced model call this week, add alerts on slow first tokens and rising cost, and expand coverage from there.
The rest of this article explains the pieces behind that verdict: the definition, the signals worth recording, the four common instrumentation paths, a worked cost example, and the privacy rules that keep traces safe to store.
The Meaning of LLM Observability
IBM describes LLM observability as collecting real time data from language models and apps about behavior, performance, and output characteristics. That definition points at the core shift. Classic application monitoring watches servers, queues, and HTTP endpoints. LLM monitoring watches model calls, and model calls behave differently from database queries.
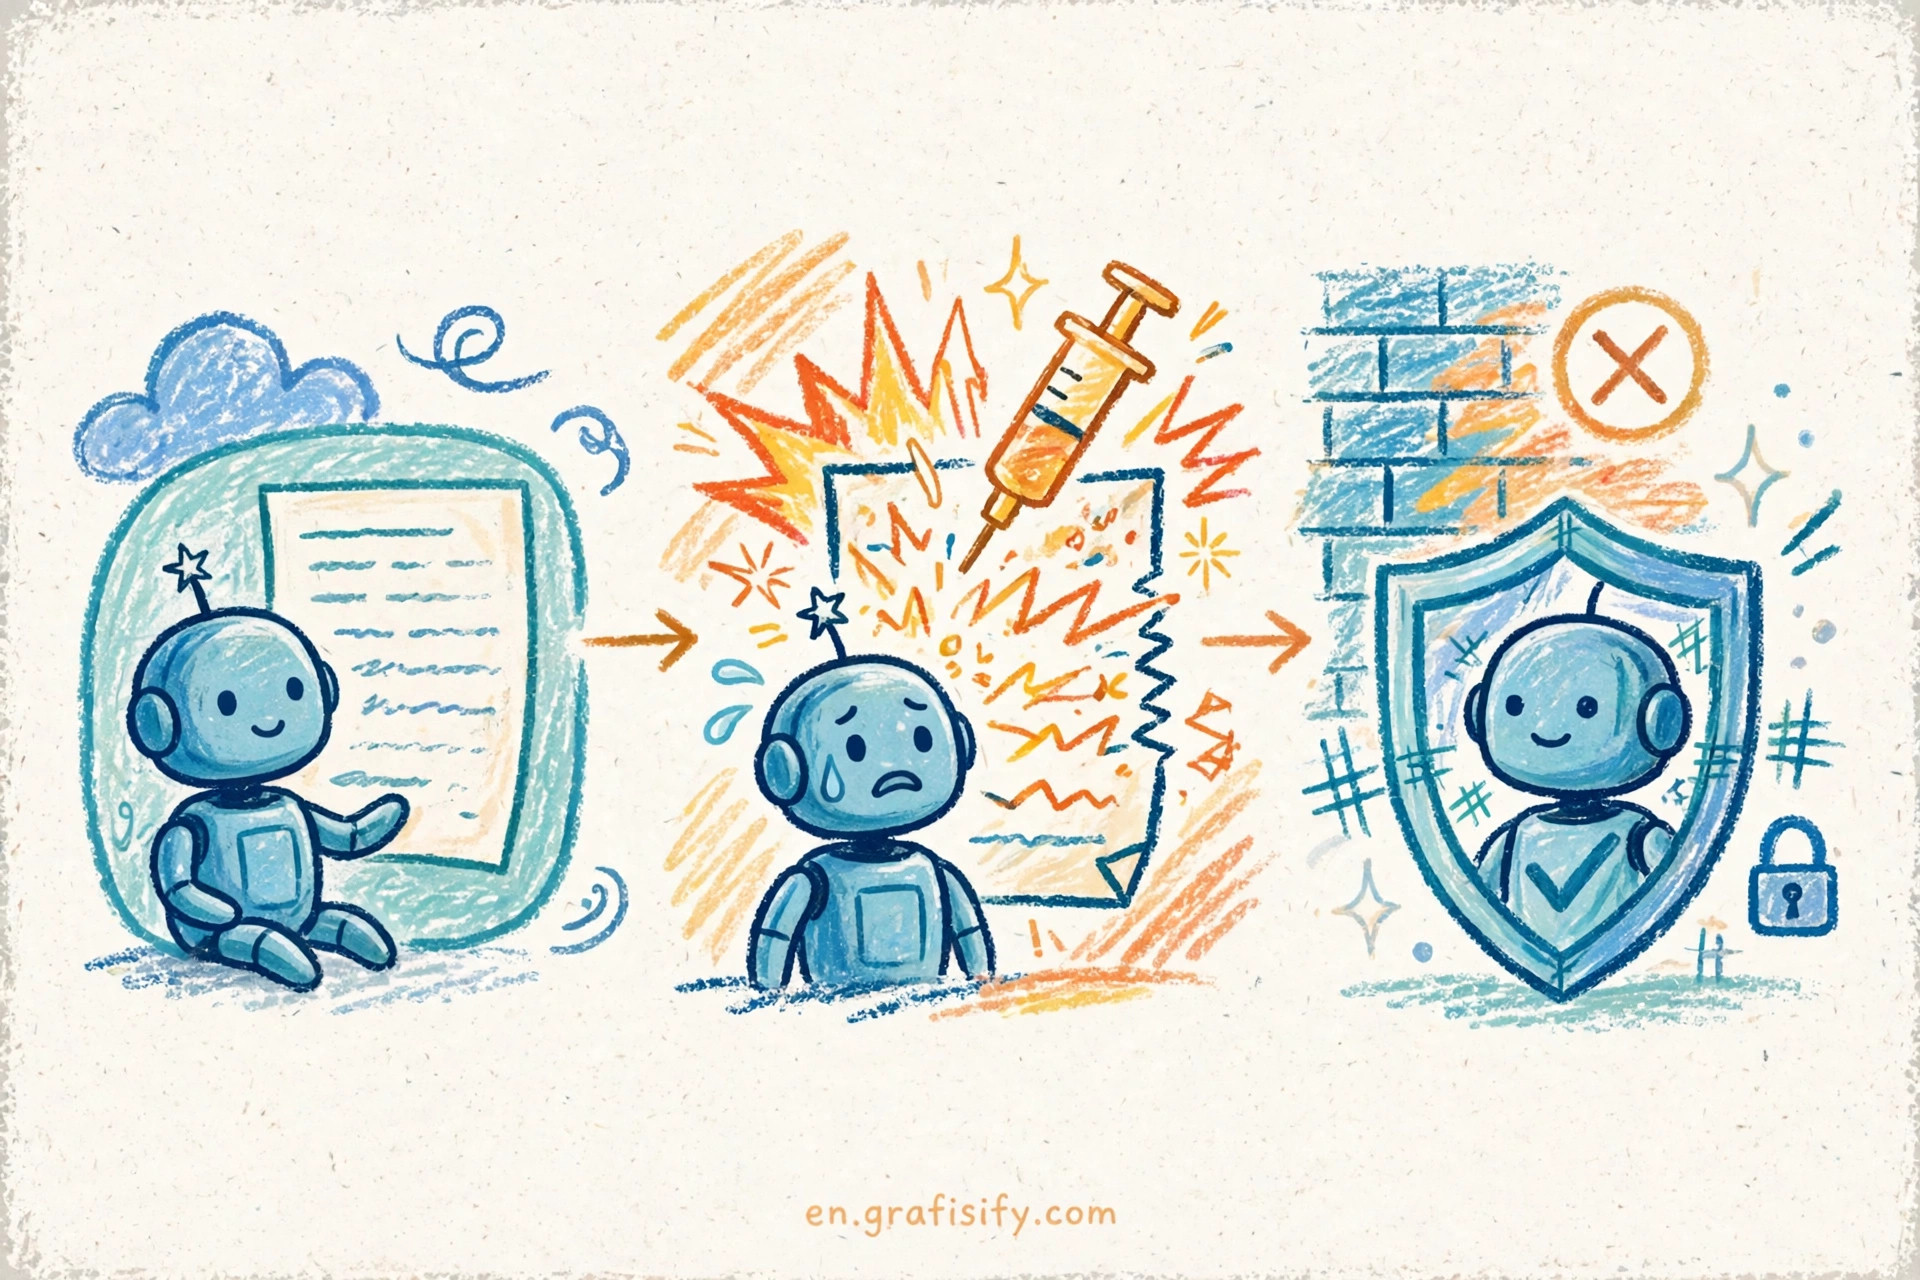
Three differences drive the practice. First, output varies. The same prompt can return a different answer on a second run, so a passing status code proves little about quality. Second, cost meters by token. A long reply, a retry loop, or a verbose tool result changes the bill in ways request counts hide. Third, work fans out. One user question can trigger an agent loop, several model calls, and a chain of tool invocations, and any one of those steps can stall the whole answer.
OpenTelemetry maintainers state the pain plainly in their GenAI observability post: an agent takes 45 seconds to answer a simple question, and the team cannot tell whether the model, a slow tool, or a retry loop caused the delay. Traces answer that question. A trace shows the span tree for one request, with timing for each model call and each tool call, so the slow step stands out at a glance.
Teams sometimes confuse LLM observability with model evaluation. The two practices complement each other. Evaluation judges answer quality against test cases. Observability records what happened in production, request by request. Pair them: use traces to find failing requests, then feed those requests into evals. Our guide to LLM evals that catch real failures covers the evaluation side in depth.
Signals Worth Recording: Traces, Metrics, and Attributes
A useful trace starts with a span tree. OpenTelemetry GenAI conventions describe an agent request as a top level invoke_agent span, with child chat spans for each model call and execute_tool spans for each tool invocation. That shape mirrors the way agents work, and it makes slow steps visible without reading raw logs.
Span attributes carry the facts that make traces searchable. The conventions define attributes such as gen_ai.operation.name and gen_ai.request.model, plus finish reasons that explain why a call stopped. Record the model name on each span, because cost and quality differ sharply across models, and a trace without a model label cannot support cost analysis.
Metrics turn traces into alerts. Five signals cover most production needs:
- Time to first token, measured at the 95th percentile, because users feel streaming delay before they see a full answer
- Tokens per request, split into input and output, because token counts drive cost and reveal runaway loops
- Cost per request, derived from token counts and current provider rates, because spend alerts catch problems that latency alerts miss
- Tool error rate, because a failing tool poisons answers even when the model call succeeds
- An eval score per prompt version, because quality regressions deserve alerts as much as outages do
OpenTelemetry also defines token counters that separate plain input tokens from cache read tokens. That split matters for cost math, as the cost section shows. One caution applies to the whole conventions set: the GenAI semantic conventions still carry Development status in their repository, so attribute names can change before they stabilize. Treat the current names as a working draft, pin the conventions version you deploy, and check release notes before upgrading.
Streaming deserves separate attention. Time to first token only makes sense when you measure the first chunk, not the completed response. Our comparison of streaming LLM APIs explains the transport choices behind that measurement.
Five Ways to Instrument, Compared
Teams usually pick one of five paths. Each path trades control against setup effort, and the right choice depends on team size, data rules, and how much prompt inspection you need.
| Approach | Cost shape | Lock-in | Prompt content capture | Best fit |
|---|---|---|---|---|
| Vendor SDK and dashboard | Free tier, then per trace billing | High | Built in, often on by default | Small teams that want setup in an afternoon |
| DIY OpenTelemetry plus any OTLP backend | Open source tooling, backend hosting cost only | Low | Off by default, opt in per span | Teams with existing observability stacks |
| Langfuse, self hosted or cloud | Free tier plus paid tiers | Medium | Configurable per project | Teams that want traces, evals, and prompt management in one place |
| LangSmith | Developer tier free, Plus at 39 dollars per seat per month | Medium | Configurable, with dataset tooling attached | Teams deep in the LangChain ecosystem |
| Existing APM with a GenAI add-on | Bundled with current APM spend | Medium | Varies by vendor | Orgs that refuse another dashboard |
Price anchors for the table come from current vendor pricing pages, checked at publish time. LangSmith lists its Developer tier at 0 dollars per seat per month with up to 5k base traces per month, and its Plus tier at 39 dollars per seat per month with up to 10k base traces per month. Langfuse lists a free Hobby tier and paid Core and Pro tiers on its pricing page. Vendor prices change without notice, so confirm the current page before budgeting.
Lock-in deserves more weight than most teams give it. A vendor SDK that owns trace collection also owns your history, your dashboards, and your alert rules. OpenTelemetry avoids that trap: the same spans can flow to Grafana, Datadog, Honeycomb, or a self hosted collector, and switching backends means changing an exporter, not rewriting instrumentation. Vendor tools still win on time to value, since they ship prompt viewers, eval datasets, and cost dashboards out of the box. A pragmatic middle path runs OpenTelemetry as the collection layer and adds a dedicated LLM tool only where prompt inspection earns its keep.
For more detail on the standards side, see the OpenTelemetry GenAI observability post and the GenAI span conventions in their repository.
Turning Tokens Into Dollars: Cost Tracing
Cost tracing starts with one formula: input tokens times the input rate, plus output tokens times the output rate, with cache reads priced separately. Token counts come from traces. Rates come from provider pricing pages. Multiply the two in telemetry, and each request carries its own dollar figure. That figure powers per feature budgets, per customer cost views, and alerts that fire when spend climbs.
OpenAI pricing shows why cache handling changes the result. Its flagship model in the current table lists 10 dollars per million input tokens, 50 dollars per million output tokens, and 1 dollar per million cached input tokens on the standard tier. The batch tier lists 5 dollars, 25 dollars, and 50 cents for the same three counters, exactly half the standard rates. A worked example makes the gap concrete: a request with 2,000 input tokens and 500 output tokens costs 2 cents of input plus 2.5 cents of output at standard rates, 4.5 cents in total. Route the same request through cached input and the input slice drops to 0.2 cents.
Anthropic pricing follows the same pattern with different ratios. Its current page prices cache reads at 0.1 times the base input price, so a cache heavy workload costs far less than naive token math suggests. Check the OpenAI pricing page and the Claude pricing page before quoting rates to stakeholders, because both pages change without notice.
Two mistakes break cost math most often. The first mistake counts cached tokens at full input price, which overstates spend on retrieval heavy workloads. The second mistake ignores output tokens, which dominate cost on long form generation. Fix both by recording four counters per request: input tokens, output tokens, cache read tokens, and cache write tokens where the provider bills them. Our guide to prompt caching savings explains the caching side in detail, including when cache writes pay off.
Cost per request also exposes product decisions that latency hides. A feature that calls a flagship model three times per user action costs three times what its single call design promised. A prompt that dumps a full document into context on each turn burns input tokens that a retrieval step could trim. Traces with dollar figures turn those debates from opinion into arithmetic.
Content Capture and Privacy: What Not to Log
Prompt content is user data, and traces that store it become a data store with retention, access, and breach implications. OpenTelemetry states the default clearly: GenAI telemetry captures metadata such as model names, token counts, and durations, and it leaves prompt content and tool arguments out unless you opt in. That default exists because prompts can hold personal data, credentials pasted by users, and proprietary business text.
Follow four rules for content capture. First, keep content capture off in production by default, and enable it only for specific spans or sampled traces with a documented reason. Second, separate operational data from user data in storage and access control, so an engineer debugging latency cannot browse full user prompts. Third, run full content capture in staging, where realistic traces help debugging without exposing real user data. Fourth, redact before storage, not after export, because a redaction step that runs at query time still leaves raw data in the store.
Tool calls deserve the same treatment as prompts. A tool argument can carry a database row, a file path, or a third party API key, and a tool result can carry a full customer record. Treat tool spans as sensitive until you prove otherwise, and sample them separately from model spans when you need volume control.
Function calling adds another wrinkle: traces show the arguments the model chose, and those arguments reveal intent as much as content. Our function-calling traces guide covers the shapes those spans take. For the security angle, review the IBM overview of LLM observability alongside your own data handling policy before enabling content capture anywhere outside staging.
Conclusion and Next Step
Ship one traced model call this week. Export it over OTLP to your current backend. Attach four metrics: time to first token, tokens per request, cost per request, and tool error rate. Keep content capture off, alert on slow first tokens and rising cost, and review trace spend monthly. That setup answers the question production teams ask most: which step made this answer slow, wrong, or expensive.
From there, grow in small steps. Add eval scores per prompt version, so quality regressions page you like outages. Add cost attribution per feature, so product decisions carry dollar figures. Add sampled content capture in staging, so debugging stays fast without risking user data. The full setup takes weeks, but the first traced call takes an afternoon, and it pays off the first time a user reports a slow answer you can explain in one trace view.

Irfan is a Creative Tech Strategist and the founder of Grafisify. He spends his days testing the latest AI design tools and breaking down complex tech into actionable guides for creators. When he’s not writing, he’s experimenting with generative art or optimizing digital workflows.





 Artificial Intelligent
 Design & Creative
 Freelance
 Gadgets & Gear
 Insights
 Laptop
 Reviews
 Smartphone
 Tech Guides
 Vibe Coding