How to Set Up Uptime Kuma on a VPS

Verdict: Why Self-Hosted Uptime Monitoring Matters
Uptime Kuma is the best free, self-hosted monitoring tool for VPS owners who want real-time uptime tracking, SSL certificate expiry alerts, and a customizable status page without paying monthly SaaS fees. With 90,000+ GitHub stars and support for 90+ notification channels, it replaces services like Pingdom, Better Uptime, and Statuspage at zero cost.
If you run a VPS, you know the anxiety of discovering a critical service went down six hours ago and nobody told you. I have been there. A client’s staging environment crashed overnight, and I did not find out until the next morning. That is when I started looking for a proper monitoring solution, and Uptime Kuma turned out to be the most practical option for self-hosted servers.
This guide walks through setting up Uptime Kuma on a Linux VPS using Docker, configuring monitors for HTTP, TCP, and Ping checks, integrating notifications through multiple channels, and building a public status page for your users. If you are new to running servers, start with our how to deploy Docker Compose on a Linux VPS guide first, then come back here. By the end, you will have a production-ready monitoring stack that costs nothing beyond your existing VPS resources.
What Is Uptime Kuma and Why Self-Host It?
Uptime Kuma is an open-source monitoring tool created by Louis Lam. The project’s official homepage and documentation are hosted at uptime.kuma.pet. You can find the full source code on its GitHub repository, which has grown to over 90,000 stars with an active community. It runs on a simple premise: you define the services you want to monitor, and it checks them at configurable intervals, alerting you the moment something fails.
Also Read:

The self-hosted approach gives you complete control over your monitoring data. No third party stores your server IPs, no monthly subscription scales with your infrastructure, and no external service becomes a single point of failure for detecting your outages. Your monitoring server lives on the same VPS or a separate lightweight instance you already pay for.
SaaS monitoring tools cost between $10 and $50 per month for basic plans. Uptime Kuma replicates most of their functionality including uptime graphs, response time history, SSL certificate monitoring, and status pages with zero licensing fees. The only cost is the Docker container resources, which are minimal.
Prerequisites and System Requirements
Before installing Uptime Kuma, make sure your VPS meets these minimum requirements:

| Component | Minimum | Recommended |
|---|---|---|
| CPU | 1 core | 2 cores |
| RAM | 256 MB | 512 MB |
| Storage | 1 GB free | 5 GB (for long-term logs) |
| OS | Ubuntu 20.04 or Debian 11 | Ubuntu 22.04+ |
| Docker | Docker 20.10+ | Docker 24+ with Compose v2 |
| Domain | Optional | Dedicated subdomain for status page |
Uptime Kuma runs as a single Docker container. It stores all monitoring data in an SQLite database by default, so you do not need a separate database server. This makes it exceptionally lightweight compared to enterprise monitoring stacks like Nagios or Zabbix that require multiple services and more complex configuration.
You also need Docker and Docker Compose installed on your VPS. If you have not set those up yet, the official Docker installation guide for Ubuntu covers the process in about two minutes. For proper security before deploying, read our Linux VPS security rules guide to harden your server first.
Step 1: Install Uptime Kuma with Docker Compose
The cleanest way to deploy Uptime Kuma is through Docker Compose. Create a directory for the project and a docker-compose.yml file:

mkdir -p ~/uptime-kuma && cd ~/uptime-kuma
nano docker-compose.yml
Paste the following configuration:

version: '3.8'

services:

  uptime-kuma:

    image: louislam/uptime-kuma:latest

    container_name: uptime-kuma

    ports:

      - "3001:3001"

    volumes:

      - ./data:/app/data

    restart: unless-stopped

    environment:

      - UPTIME_KUMA_PORT=3001
Run the container:
docker compose up -d
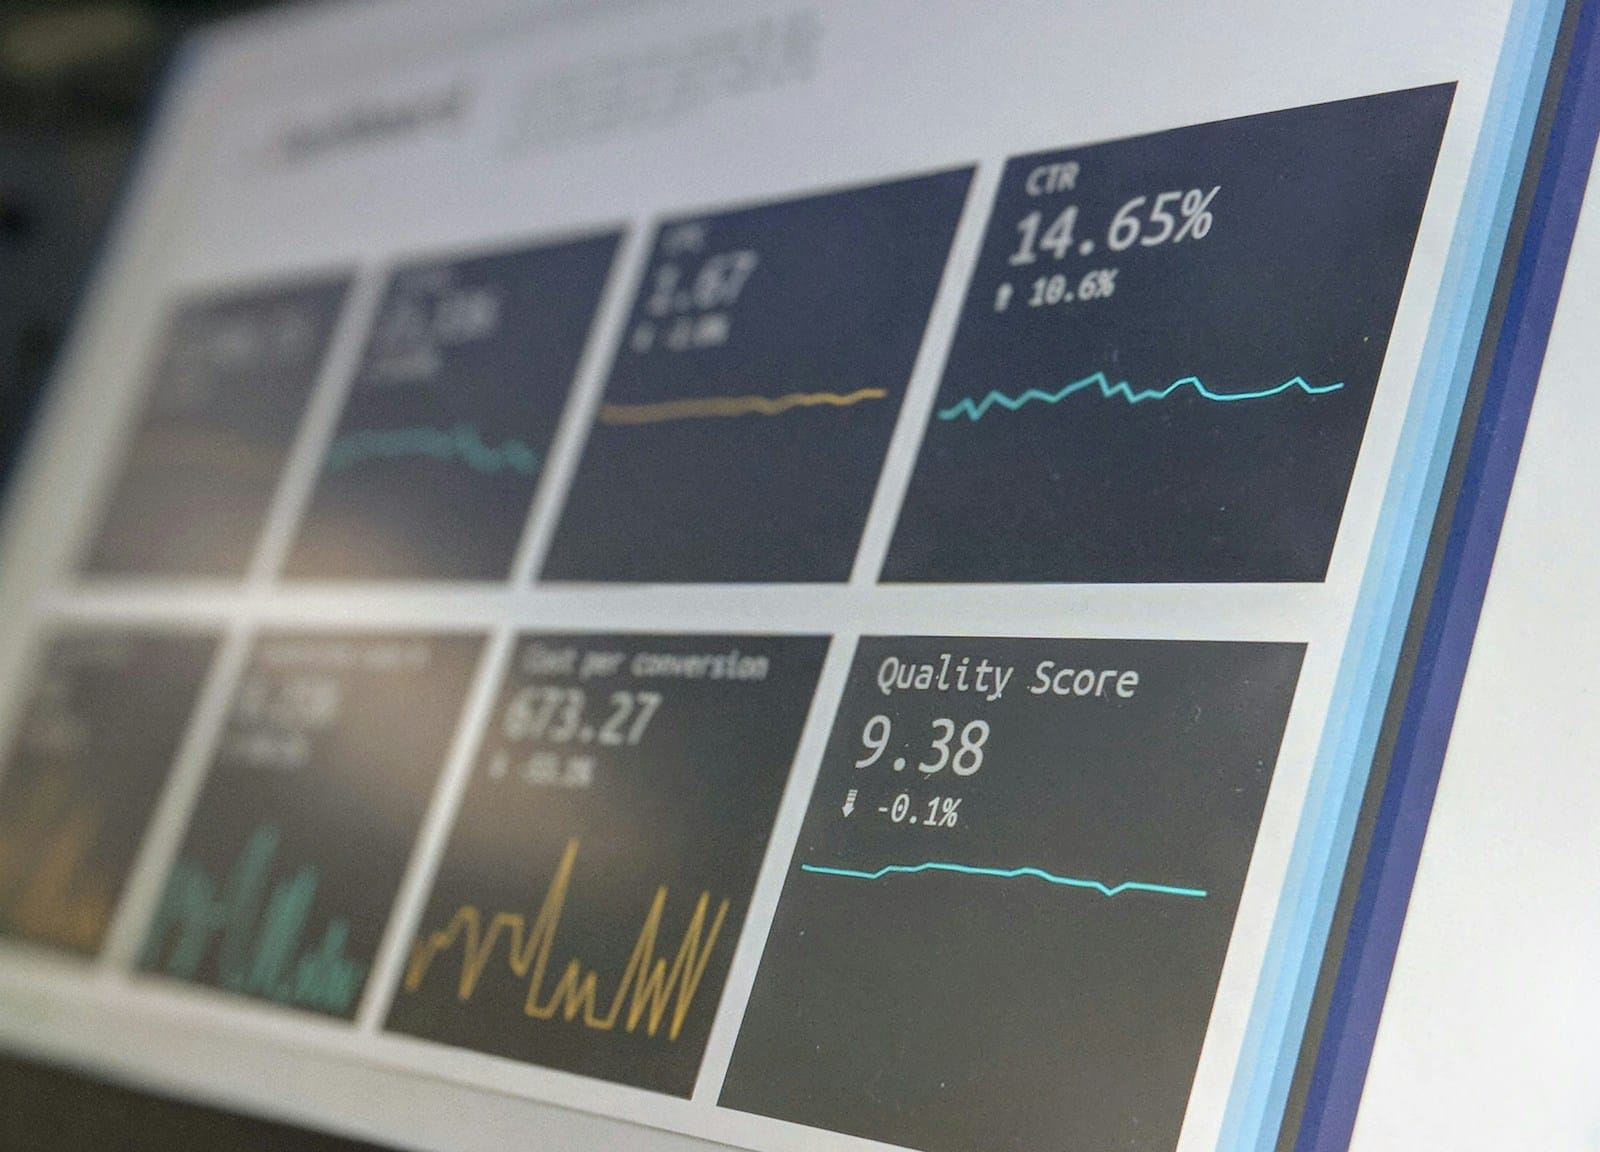
The dashboard is now accessible at http://YOUR_VPS_IP:3001. Open it in your browser, create an admin account, and you will see the main monitoring interface. The initial setup takes less than two minutes from running the command to seeing a functional dashboard.
The ./data directory stores your entire configuration including monitors, notification settings, and the status page. Backing up this single directory is sufficient to restore the entire monitoring setup on a new server. I recommend adding it to your regular backup routine.
Step 2: Configure SSL with a Reverse Proxy
Exposing port 3001 directly to the internet works for testing, but a production setup needs TLS encryption and a proper domain. Nginx Proxy Manager is the easiest reverse proxy to pair with Uptime Kuma because it handles SSL certificates automatically through Let’s Encrypt. Our Nginx Proxy Manager setup guide covers the full installation process.
A quick comparison of reverse proxy options:
| Proxy | SSL Setup | Learning Curve | Best For |
|---|---|---|---|
| Nginx Proxy Manager | Automatic via Let’s Encrypt | Low | Most users |
| Caddy | Automatic via Let’s Encrypt | Low | Minimal config |
| Nginx manual | Manual certbot | Medium | Existing Nginx setups |
| Traefik | Automatic via Let’s Encrypt | High | Docker-native stacks |
I use Nginx Proxy Manager for most of my services. After setting it up, add a proxy host pointing to http://localhost:3001 with your chosen subdomain like status.yourdomain.com. Enable SSL, select “Force SSL,” and the certificate is provisioned automatically. The entire SSL setup takes about five minutes.
Once the proxy is configured, access Uptime Kuma through your secure domain. The dashboard now runs over HTTPS and is ready for production monitoring.
Step 3: Add Your First Monitors
Uptime Kuma supports several monitor types. The most useful ones for a typical VPS setup are:
| Monitor Type | What It Checks | Use Case |
|---|---|---|
| HTTP(S) | HTTP status code and response time | Web apps, APIs, dashboards |
| TCP | TCP port reachability | SSH (22), databases (3306, 5432) |
| Ping | ICMP reachability | Server availability, network health |
| DNS | DNS record resolution | Domain propagation, DNS health |
| SSL Certificate | Certificate expiry and validity | All HTTPS services |
Click the “Add New Monitor” button. For a web application, select HTTP(S) and enter your full URL including https://. Set the check interval to 60 seconds for critical services and 5 minutes for less important ones. Enable “Resolve DNS” to ensure DNS resolution works alongside the HTTP check.
For SSL monitoring, add a separate monitor of type “SSL Certificate” pointed at your domain. Set the expiry threshold to 30 days, so you get notified before the certificate expires. This has saved me multiple times when Let’s Encrypt auto-renewal failed due to a port conflict.
I monitor at least five things on every VPS: the main web application, the SSH port via TCP check, the database port, the domain DNS resolution, and the SSL certificate expiry. This covers 90% of failure scenarios that actually affect users.
Step 4: Set Up Notifications
The notification system is where Uptime Kuma shines. It supports over 90 notification channels through the Apprise notification library. The most practical channels for most users are:
| Channel | Setup Difficulty | Reliability | Best For |
|---|---|---|---|
| Telegram | Easy | High | Instant mobile alerts |
| Email (SMTP) | Medium | Medium | Formal reporting |
| Discord Webhook | Easy | High | Team channels |
| Slack Webhook | Easy | High | Workplace integration |
| Gotify | Medium | High | Self-hosted push notifications |
To set up Telegram notifications, create a bot through BotFather and get your chat ID. In Uptime Kuma, go to Settings, Notifications, select Telegram, and paste your bot token and chat ID. Test the notification immediately using the built-in test button.
I run two notification channels simultaneously: Telegram for instant alerts and email for daily digests. This ensures I never miss an outage even if Telegram has a temporary issue. You can configure different notification rules for different monitors so critical services alert through all channels while non-critical ones only send email.
Step 5: Build a Public Status Page
A status page gives your users transparency about your service health without them having to contact you. Uptime Kuma includes a built-in status page builder that generates a clean, responsive page with uptime percentages and incident history.
Go to Settings, Status Page, and create a new page. Give it a title, add the monitors you want to display publicly, and set a custom domain or subdomain if you configured the reverse proxy earlier. The status page generates automatically and updates in real time as monitors change state.
You can customize the page with your brand colors, logo, and a custom CSS snippet for additional styling. The incident section lets you post updates during outages so visitors see “Investigating” or “Resolved” instead of just a red indicator.
I keep my status page separate from the main admin dashboard by creating a dedicated subdomain like status.example.com. The status page only shows uptime data and never exposes any login or configuration options, so it is safe to make fully public.
Comparison: Uptime Kuma vs Popular Monitoring Alternatives
To help you decide if self-hosted monitoring fits your needs, here is how Uptime Kuma compares against the most common alternatives:
| Feature | Uptime Kuma | Pingdom | Better Uptime | Checkmk |
|---|---|---|---|---|
| Price | Free | From $10/mo | From $20/mo | Free (limited) |
| Self-Hosted | Yes | No | No | Yes |
| Notification Channels | 90+ | 15+ | 20+ | 30+ |
| Status Page | Built-in | Paid add-on | Included | Paid add-on |
| SSL Monitoring | Yes | Yes | Yes | Yes |
| Response Time History | 90 days | Unlimited | 30 days | Unlimited |
| Setup Time | 10 minutes | 5 minutes | 5 minutes | 30 minutes |
| Data Privacy | Full | Vendor managed | Vendor managed | Full |
Uptime Kuma wins on cost and privacy but requires you to manage the server and keep it updated. Pingdom and Better Uptime are better if you want a zero-maintenance solution and can justify the monthly cost. Checkmk is more powerful for infrastructure monitoring but overkill if you only need uptime checks.
Maintenance and Backup Tips
Uptime Kuma requires minimal ongoing maintenance. The container image updates roughly once a month. For container security best practices, check our Docker container hardening guide. To update, pull the latest image and recreate the container:
docker compose pull && docker compose up -d
Back up the ./data directory regularly. This single directory contains your monitors, notifications, status page configuration, and monitoring history. A simple cron job that copies this directory to off-server storage is sufficient disaster recovery.
Set up a meta-monitor: configure a second monitoring service like Dead Man’s Snitch or a free cron job service to ping Uptime Kuma itself. If Uptime Kuma goes down, this external checker sends you an alert. I use a free Healthchecks.io endpoint that pings my Uptime Kuma instance every 10 minutes and sends an email if it misses three consecutive pings.
Monitor resource usage. Uptime Kuma is lightweight, but if you monitor 50+ services with 60-second intervals, the SQLite database can grow large over time. I clean the monitoring history older than 90 days every quarter using the built-in data retention settings.
Frequently Asked Questions
Is Uptime Kuma really free?
Yes. The software is MIT licensed with no paid tiers, no feature gating, and no subscription. All monitoring types, notification channels, and status page features are included in the free version.
Can Uptime Kuma monitor internal services?
Yes. If your VPS can reach the service over the network, Uptime Kuma can monitor it. This includes services on private IPs, localhost ports, and VPN-connected infrastructure. The monitors run from the VPS itself, so they see everything your VPS sees.
How many monitors can one instance handle?
A single Uptime Kuma instance on a 1 GB RAM VPS can handle 100 to 200 monitors with reasonable check intervals. Performance degrades when you have 500+ monitors all checking every 30 seconds, but for most individual developers and small teams, the limit is rarely reached.
Does Uptime Kuma support team access?
Yes. You can create multiple user accounts with different permission levels. Users can view monitors, manage their own notifications, or have full admin access depending on how you configure their role.
What happens if the VPS running Uptime Kuma goes down?
Uptime Kuma cannot monitor itself. Use a free external monitoring service like Better Stack’s free tier or Healthchecks.io to ping your Uptime Kuma instance from outside and alert you if it becomes unreachable.
Final Thoughts
Uptime Kuma solves the most common monitoring problem for VPS owners: knowing when something breaks without paying for an enterprise tool. I have been running it for over a year across three servers and it has caught SSL expiry issues, disk-full outages, and application crashes that would otherwise have gone unnoticed until a user complained.
The setup takes about 10 minutes if you already have Docker running, and the ongoing maintenance is limited to occasional updates and a simple directory backup. For the cost of a single SaaS monitoring subscription you could run Uptime Kuma for years on the same VPS you already own.
Start with monitoring your most critical services: your web application, SSH access, database, and SSL certificate. Add notifications through Telegram or email. Expand to more monitors as you get comfortable. The peace of mind from knowing your services are watched 24/7 is worth the small setup effort.
Start monitoring your VPS today: deploy Uptime Kuma on your server and set up your first monitor in under 10 minutes. Your future self will thank you when the next outage happens at 3 AM and your phone buzzes with an alert before any user reports it.

Irfan is a Creative Tech Strategist and the founder of Grafisify. He spends his days testing the latest AI design tools and breaking down complex tech into actionable guides for creators. When he’s not writing, he’s experimenting with generative art or optimizing digital workflows.




 Artificial Intelligent
 Design & Creative
 Freelance
 Gadgets & Gear
 Insights
 Laptop
 Reviews
 Smartphone
 Tech Guides
 Vibe Coding